Article Text

Abstract
Objective In diffusely infiltrating gliomas (DIG), positron emission tomography (PET) imaging is a powerful method for detection of anaplastic foci. Recently, 1H-magnetic resonance spectroscopy chemical shift imaging (CSI) using choline/creatine (Cho/Cr) or choline/N-acetylaspartate (Cho/NAA) ratios has emerged as a new non-invasive, widely available alternative. The authors therefore correlated CSI with 11C-methionine (MET)-PET data in a series of DIG with non-significant contrast-enhancement (CE).
Methods Thirty-two patients with DIG were examined with single-slice CSI on a 3 T MRI and MET-PET. Maximum pathological intratumoural ratios of CSI (=CSImax) and maximum tumour-to-normal-brain PET ratios (=PETmax; T/N ratio) were determined. Coregistration of MRI with CSI and PET was performed, and the topographic overlap of CSImax and PETmax was analysed. Histological criteria of anaplasia as well as cell proliferation rate were assessed in tumour samples inside and outside CSImax.
Results CSI showed a pathological ratio in all patients, whereas PET demonstrated a pathological T/N ratio in 21/32 patients. Topographical correlation of CSImax and PETmax revealed a ≥50% overlap in 18/21 and <50% overlap in 3/21 patients, respectively. Cho/Crmax and Cho/NAAmax showed a ≥50% overlap in 24/32 and a <50% overlap in 8/32 patients. Cell proliferation rate was significantly higher inside than outside the CSImax (13.6% vs 6.9%, p<0.001).
Conclusion The results indicate that CSI is a promising method for detection of anaplastic foci within DIG with non-significant CE. Intraoperative use of CSI by multimodal neuronavigation may increase the reliability of detection of malignant areas in glioma surgery and therefore optimise allocation of patients to adjuvant treatments.
- Diffusely infiltrating gliomas
- chemical shift imaging
- methionine positron emission tomography
- correlation of maxima
- proliferation rate
- MRI
- MRS
- Neurosurgery
- PET
- Tumours
Statistics from Altmetric.com
- Diffusely infiltrating gliomas
- chemical shift imaging
- methionine positron emission tomography
- correlation of maxima
- proliferation rate
- MRI
- MRS
- Neurosurgery
- PET
- Tumours
Introduction
Standard neuroradiological imaging of diffusely infiltrating gliomas (DIG) by MRI is frequently unable to visualise the most malignant areas within these potentially heterogenous tumours.1–4 However, intraoperative identification of anaplastic foci is essential, because only representative histology indicates which postoperative therapy is adequate.
In DIG with non-significant contrast-enhancement (CE), positron emission tomography (PET) represents a clinically useful method for the preoperative detection of malignant areas. For this purpose, the metabolic information of amino-acid tracers, for example 11C-methionine-PET (MET-PET) or 18F-fluoroethyl-l-tyrosine-PET (FET-PET), is frequently used.5–10 In the case of MET-PET, histological analysis confirmed that voxels with maximum tracer uptake (=PETmax) represent the most malignant tumour areas.8 9 11 12 Therefore, neuronavigation based on MET-PET data coregistered with anatomical images is a powerful tool in glioma surgery.13 14 In cases of biopsy, the accurate targeting of the most malignant tumour area indicated by PETmax is supported; in cases of tumour resection, reliable removal of the most malignant tumour areas is warranted. Further, MET-PET imaging is useful for postoperative follow-up of low-grade gliomas. In these patients, PET facilitates early recognition of tumour progression and recurrence.9 15 Altogether, MET-PET plays an important role in preoperative planning, intraoperative multimodal neuronavigation and postoperative follow-up of glioma patients.
However, PET exposes the patient to radiation exposure and is only available in highly specialised neurooncological centres. Thus, an alternative diagnostic tool is of interest: multivoxel proton magnetic resonance spectroscopy (MRS), termed chemical shift imaging (CSI), has recently emerged as a promising non-invasive metabolic imaging technique. CSI can be performed in the frame of standard MRI with a short acquisition time and is thus a widely available investigational tool. Like PET, CSI allows intratumoural detection of most malignant areas by examination of the spatial distribution of metabolites in DIG. Typically, the CSI metabolic profile of gliomas includes: increase in choline (Cho), due to increased cell membrane turnover, reduction or loss of N-acetylaspartate (NAA), as a consequence of impairment of neuronal function, a frequently encountered reduction in creatine (Cr), a marker for tissue energy metabolism due to a hypermetabolic state, and the common presence of lipid and lactate due to tissue necrosis and change to anaerobic metabolism.16–20 For identification of the most malignant intratumoural areas within gliomas, the clinical use of the metabolite ratios Cho/Cr18 21–28 and Cho/NAA10 18 21–23 25 26 has been established.
To analyse the ability of this new metabolic imaging technique to detect anaplastic foci in DIG with non-significant CE, we determined the maximum intratumoural ratios of CSI metabolites (=CSImax), performed a topographic correlation of CSImax with MET-PET and assessed histological criteria of anaplasia as well as cell proliferation rate in tumour samples inside and outside CSImax.
Methods
The study cohort comprises a consecutive series of 38 patients with DIG with non-significant CE treated at the Department of Neurosurgery of the Medical University of Vienna between July 2007 and November 2009. This study was approved by the ethics committee of the Medical University of Vienna.
All patients underwent MRI, CSI and MET-PET investigations within 2 weeks before the neurosurgical procedure. After topographic correlation of CSI and MET-PET data, 6/38 patients had to be excluded for the following reasons. In three patients, PETmax was too close to the skull, which did not allow a reliable CSI analysis due to bone artefacts; in three further patients, the CSI slice was outside PETmax, as CSI examinations were performed without knowledge of MET-PET results. Therefore, 32 patients (16 females, 16 males) remained for further analysis (table 1). The median age of our study cohort was 44 years (range 16–66 years). In 21 (66%) patients, gross total resection was performed, six (19%) patients had partial resection, and five (15%) patients underwent stereotactic biopsy. The extent of resection was assessed on T2-weighted MRI performed within 48 h postoperatively. Tumour localisation was supratentorial in all cases. Newly diagnosed tumours were present in 23 cases, and nine patients with previous surgery for low-grade gliomas had suspected tumour recurrence/progression. None of the patients had previously received radio- or chemotherapy.
Patient characteristics
MET-PET investigations
Patients received 800–850 MBq 11C-methionine after fasting for 4 h. PET images were then obtained from a dedicated full-ring GE Advance PET scanner (General Electric Medical Systems, Milwaukee, Wisconsin). For a detailed description of radiotracer production, data acquisition and reconstruction see Potzi et al.29
The scanner produces 35 slices with a slice thickness of 4.25 mm in a field of view of 14.875 cm. The spatial resolution of the scanner in axial direction is 4.0 mm and in tangential direction 3.8 mm. Image reconstruction was done by filtered back-projection using a Hanning Filter with a cut-off value of 6.2 mm and a 256×256 matrix.
For the semiquantitative evaluation of tracer accumulation in tumour tissue, the standardised uptake value (SUV) and the calculated ratio tumour/contralateral normal tissue (T/N ratio) were used. The SUV was defined as radioactive concentration (MBq/g)/injected dose (MBq)×body weight (g). For quantification, a circular region of interest (ROI) was drawn over the tumour lesion with knowledge of tumour localisation from structural imaging and clinical data, and covering the hottest pixel of the lesion. Afterwards, this ROI was mirrored contralaterally to the unaffected hemisphere. Maximal SUVs of these ROIs and T/N ratios were calculated.
PETmax definition
To define a threshold for pathological tracer uptake in PET, a T/N ratio was considered as normal below 1.15 or as non-specific (1.15 to <1.5). A T/N ratio ≥1.5 was regarded as pathological. Areas with the highest pathological T/N ratios, reflecting the most intense tracer uptake, were defined as PETmax.
MRI/CSI investigations
Our routine MRI protocol for brain tumours consisted of axial fluid attenuated inversion recovery sequences, diffusion-weighted images, axial, coronal T1- and T2-weighted sequences, and contrast-enhanced axial, coronal and sagittal T1-weighted sequences. All gliomas were classified by a neuroradiologist (DP) according to the pattern of CE. Only patients with none or unspecific (defined as ‘patchy’ and ‘faint’) CE were included in the study cohort of the initial 38 cases. Patients with unequivocal (defined as ‘nodular’ or ‘ring-like’) CE as a target for tissue sampling were not part of this study.
With the CSI software integrated in our routine clinical 3 T MRI scanner (Tim Trio, Siemens, Erlangen, Germany), a single slice (2D) CSI examination could be performed in the course of the same examination as morphological MRI.
The protocol for CSI consisted of a T2-weighted turbo spin echo sequence and a contrast-enhanced axial T1-weighted gradient echo sequence for navigation purposes. Point-resolved spectroscopy sequence (PRESS; repetition time/effective echo time 1500/135 ms) preceded by chemical shift selective (CHESS) water suppression was used for excitation of rectangular voxel of interest (VOI) selection (4–12 cm in both plane dimensions) excluding skull and subcutaneous tissue contamination. The position of the CSI slice was chosen to cross the largest diameter of the lesion on T2-weighted images. Sequence parameters included 16×16 elliptical weighted phase-encoding steps across a 16×16 cm field of view (FOV), slice thickness of 1 cm, 50% Hamming filter and three averages. Application of Hamming filter reduces the effect of ‘point-spread-function’ and affects the volume resolution from nominal cubic volume 1 cm3 to effective overlapping cylindrical volumes of ∼1.8 cm3. The total acquisition time was less than 7 min.
Maps of the metabolic ratios Cho/total NAA (=NAA and N-acetylaspartylglutamate) and Cho/Cr were produced using the spectroscopy application within the spectrometer operating system (SyngoMR VB13 and VB15, Siemens, Erlangen, Germany). After zero filling, phasing and filtering (Hanning Filter, 400 ms) of the data, polynomial baseline correction was applied and a line fit in the frequency domain was used to obtain Cho, Cr and total NAA signal intensity (area under the peak). Metabolic ratio maps were created within the VOI using the numerical value interpolation as implemented by the manufacturer.
The CSI postprocessing software uses a rainbow-type colour lookup table whereby blue–green–yellow–red correspond to values from zero to maximum (see figure 1).

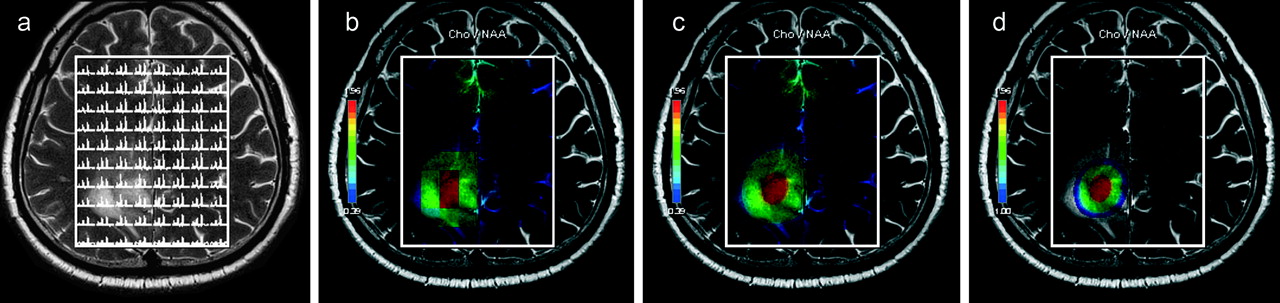
Methods: chemical shift imaging (CSI) data processing and metabolic ratio map creation. (A) Matrix (8×10) of multivoxel 1H magnetic-resonance spectra from fronto-parietal brain region including the tumour lesion. (B) Maps of the metabolic ratios choline (Cho)/N-acetylaspartate (NAA) produced using the spectroscopy application within the spectrometer operating system. After zero filling, phasing and filtering of the data, polynomial baseline correction was applied, and a line fit in the frequency domain was used to obtain the Cho and NAA signal intensity. (C) Metabolic ratio maps, created within the VOI using the numerical value interpolation as implemented by the manufacturer. The lower limit of the colour map (blue) corresponds to a value of Cho/NAA 0.39 in this patient. (D) Rescaling of colour map according to the predefined pathological CSI ratio of ≥1. The blue colour code corresponds to the CSImin of 1.00. The red colour code shows the tumour area with the highest Cho/NAA CSI ratio (CSImax=1.96 in this patient).
CSImax definition
A threshold of CSI ratio is needed to define pathological areas. Therefore, we tested various ratios in pilot CSI examinations preceding our study. We compared tumour areas with the contralateral tumour-free white matter. For both Cho/Cr and Cho/NAA, a ratio of ≥1.0 proved suitable as a cut-off for specific colour-coded visualisation of the tumour area. Using this method, normal brain was not visualised. The area with the highest pathological CSI ratios within a given tumour, reflecting the most abnormal metabolite ratio, was defined as CSImax (Cho/Crmax or Cho/NAAmax; figure 1D).
PET/CSI coregistration
Due to a lack of spatial information, it is impossible to perform registration of a single slice of CSI metabolic map with an anatomical MR image stack that is routinely used for intraoperative navigation. To enable registration, additional anatomical information is needed. Therefore, similarily to Stadlbauer,30 we performed the following workaround: T2-weighted TSE MR images (15 slices, 2 mm slice thickness) centred around CSI FOV position were obtained. This image stack had an FOV identical to the CSI FOV (16×16 cm) and a matrix resolution identical to the resolution of the standard CSI metabolic map (256×256). This data set provided the geometrical basis for the data integration into the navigation system. The CSI metabolic maps were projected on five central image slices from this T2-weighted stack, which were interposed between 10 empty slices containing only geometrical information from the T2-weighted images, five on top and five below the CSI map projections. The central five identical CSI slices of 2 mm thickness represent the real CSI slice acquisition dimension of 1 cm. This MRI/MRS hybrid data set was called the ‘CSI sandwich’ (figure 2).

Methods: registration of single-slice chemical shift imaging (CSI) on morphological MRI data for intraoperative navigation. Step 1: image registration of T2-weighted anatomical dataset (co-planar to CSI stack) to the standard T1-weighted contrast-enhanced (CE) MR images. Step 2: manual copying of the resulting registration matrix file from the T2-weighted anatomical image stack to the folder of the CSI sandwich dataset on the navigation system. Step 3: for intraoperative application, the resulting registered morphological T1-weighted and metabolic CSI image datasets are loaded into the navigation system.
Prior to surgery, the T2-weighted anatomical dataset was coregistered to the standard T1-weighted contrast-enhanced MR images using the semiautomated registration algorithm of the navigation software (Stealth Station Cranial Mach 5; Medtronic, Louisville, Colorado). The system creates a registration matrix file for the T2-weighted anatomical image stack that was manually copied to the folder of the CSI sandwich dataset. This workaround resulted in a coregistration of the T1-weighted anatomical MR image data and the CSI slice.
Topographic correlation of CSImax and PETmax
The navigation software provides a rainbow-type colour lookup table which converts the grey scale values of the PET and CSI data to a black–red–yellow–green–blue–purple–white colour scale. (Notably, the navigation software colour scale is in the opposite direction to the MRI software colour scale: CSImax appears in red on the MRI software (see figures 1, 5C) and in white on the navigation software—see all other figures.)
Prior to the topographic correlation of CSImax and PETmax, we used the following windowing adjustments as standard in the navigation system. For removal of background tracer-uptake of normal brain in PET, the level slider was set to maximum, and the width was increased from zero to just before the first background uptake of normal brain appeared. For CSI, we used maximum level and width as standard.
After image fusion with contrast-enhanced MRI, the degree of overlap of CSImax and PETmax areas visualised by this method was estimated semiquantitatively by visual impression by two authors (SW, GW) as follows: (1) Cho/Crmax and PETmax, (2) Cho/NAAmax and PETmax, and (3) Cho/Crmax and Cho/NAAmax (table 1). The degree of overlap of the maxima of CSI and PET was categorised as follows: (1) overlap ≥50%; (2) overlap <50%; (3) distant (no overlap).
The centre of the CSImax and PETmax areas was regarded as the area of maximum metabolism and therefore used as the target point for intraoperative tissue sampling with the aid of neuronavigational guidance.
Tissue sampling
Intraoperative navigation was performed with the coregistered CSI/PET/MRI data set. To minimise the effects of potential brain shift in our study, we used either conventional stereotactic biopsy through a burr hole (n=5 of 32 cases, table 1) or a technique very similar to a frameless stereotactic biopsy (n=27 of 32 cases). To minimise CSF loss, the patient positioning was selected with the craniotomy at its highest level. Immediately after dural opening, navigation accuracy was verified on surface veins successfully in all patients. Subsequently, the targets inside CSImax and/or PETmax were approached through a small corticotomy using a stereotactic biopsy needle tracked by the navigation system. Sampling of the target area was deliberately performed before tumour resection to ensure a minimal interference with the brain shift that would render the navigation-guided tissue sampling inaccurate.
Intraoperative tissue sampling was performed as follows:
If the Cho/Crmax and Cho/NAAmax overlap was ≥50%, one tissue sample was taken from this area defined as CSImax.
If Cho/Crmax and Cho/NAAmax did not show a significant overlap (<50%), specimens were collected from the area of higher metabolite ratio (defined as CSImax).
If CSImax and PETmax showed an overlap of ≥50%, one tissue sample was taken from this area.
If CSImax and PETmax showed an overlap of <50%, separate specimens were taken from both areas.
If PET was negative or showed only unspecific tracer uptake, specimens were taken from CSImax.
To additionally determine the ability of the metabolic imaging methods to detect anaplastic foci, intratumoural tissue samples outside CSImax and/or PETmax were collected also by using the stereotactic biopsy needle for histopathological correlation purposes. In case of a glioma resection, additionally multiple tissue specimens were collected during tumour removal from intratumoural areas located definitely outside CSImax and/or PETmax, as shown by the navigation system.
Neuropathology
Histopathological tumour typing was performed by the local neuropathology according to the WHO 2007 criteria.31 In each case, all tumour specimens were systematically analysed by one author (JAH) for anaplastic tissue areas (defined as areas with mitotic figures, necrosis, microvascular proliferation, increased cell density and nuclear pleomorphism) for statistical analysis and to avoid undergrading. For histopathological diagnoses, see table 1.
Additionally, tumour cell proliferation was assessed immunohistochemically using the MIB-1 antibody (anti-Ki-67, 1:50; DAKO). MIB-1 binding was apparent as nuclear staining. In each specimen, a total of 500 tumour cell nuclei were evaluated in ‘hot spots,’ that is, fields showing the highest density of Ki-67 immunopositive cells by one author (AW), who was unaware of clinical patient characteristics. The fraction of immunolabelled tumour cell nuclei was expressed as a percentage (MIB-1 labelling index (LI)).
If more than one sample of CSImax, PETmax and the tumour area outside CSImax and/or PETmax was available, the sample with the most anaplastic histopathological criteria as described above and with the maximum MIB-1 LI was selected for statistical analysis.
Statistical analysis
For statistical analyses SPSS version 16.0 software was used. The presence of histopathological criteria of anaplasia inside versus outside CSImax and PETmax was compared using the χ2 test. MIB-1 LI values showed a right-skewed distribution. Thus, for comparison of cell proliferation rates in different areas of a given tumour, a non-parametric test (Wilcoxon rank-sum test for paired data) was applied. Values are given as mean and SD. A p value of <0.05 was considered significant.
Results
Intratumoural metabolite ratios
CSI ratios were pathological (≥1.0) in all patients: the Cho/Cr ratio was 2.7±1.6 (range 1.2–9.4), and the Cho/NAA ratio was 4.4±3.7 (range 1.2–14.7) (table 1).
MET-PET demonstrated pathological (T/N ≥1.5) tracer uptake in 21/32 patients. In these cases, the PET T/N ratio was 2.2±0.7 (range 1.5–3.9). However, normal (T/N 0.9–1.1) or non-specific (T/N 1.2–1.4) tracer uptake was encountered in seven and four of 32 patients, respectively.
Topographic correlation
CSI versus PET
Topographic correlation was possible in 21 patients with pathological CSI ratios (ratios ≥1) and unequivocal pathological MET-PET T/N ratios (ratio ≥1.5). A ≥50% overlap of CSI (Cho/Crmax and Cho/NAAmax) and PETmax was found in 18/21 cases, and an overlap of <50% was present in 3/21 patients (figure 3, table 1).

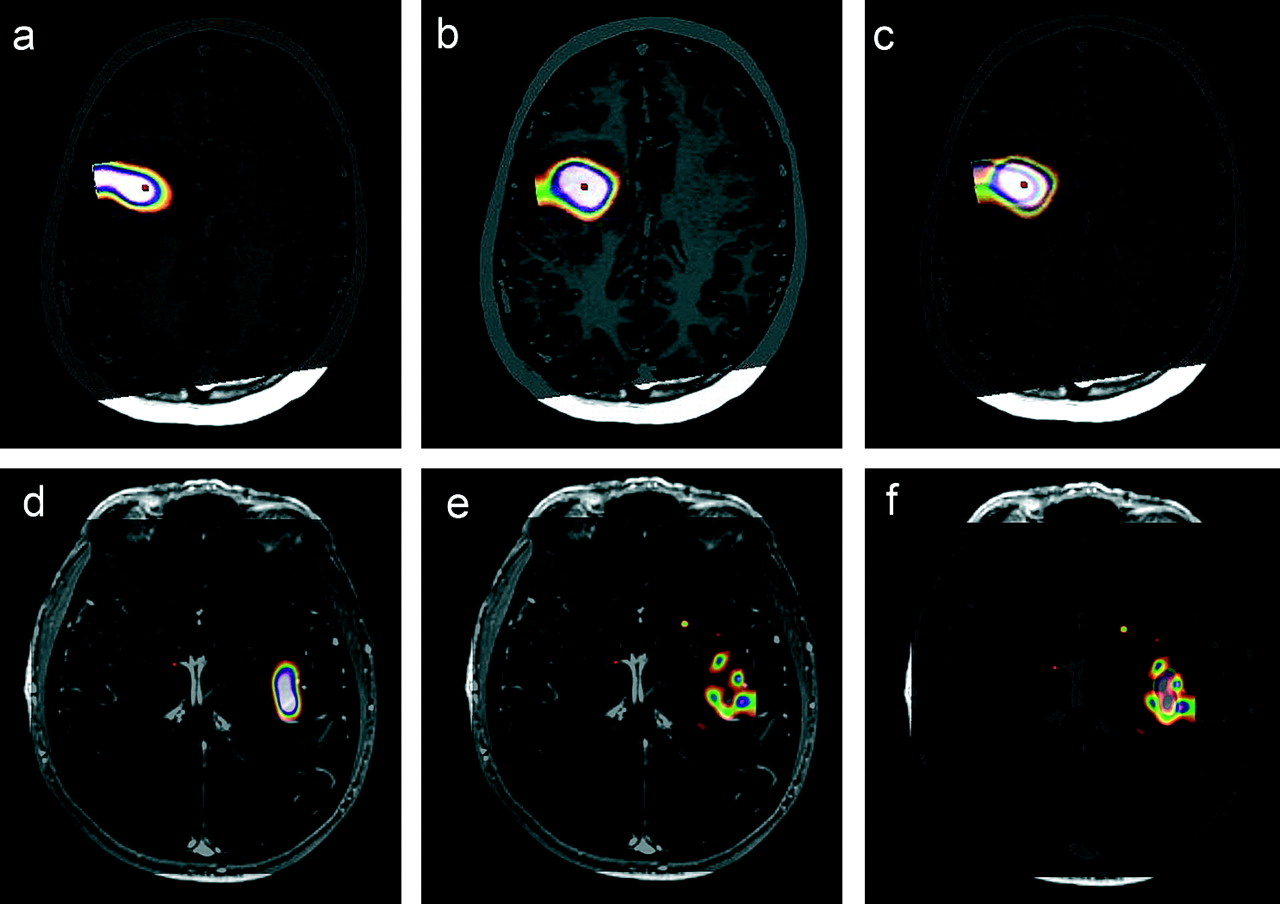
Topographic correlation of 11C-methionine-positron emission tomography (PET) and chemical shift imaging (CSI) maxima. (A–C) Right parietal oligodendroglioma WHO grade II (case 22). (A) PETmax; (B) CSI choline (Cho)/creatine (Cr)max; (C) PET/CSI coregistration resulting in >50% maxima overlap. (D–F) Left precentral oligodendroglioma WHO grade II (case 25). (D) PETmax; (E) CSI Cho/N-acetylaspartate (NAA)max; (F) PET/CSI coregistration resulting in <50% maxima overlap.
Due to the lack of a pathological PET T/N ratio (ratio <1.5), correlation was not possible in 11/32 cases: in 7/11 patients with normal T/N ratio, CSI ratios were pathological, and histopathological examination revealed a glioma WHO grade II in five and grade III in two patients, respectively. In the remaining 4/11 patients with non-specific tracer uptake, pathological CSI ratios were detected as well (WHO grade II in two and grade III in two patients, respectively).
CSI: Cho/Cr versus Cho/NAA
An overlap of Cho/Crmax and Cho/NAAmax was found: ≥50% in 24/32 and <50% in 8/32 cases, respectively. Of the cases with <50% overlap, 6/8 cases exhibited a peculiar pattern with a central Cho/NAA maximum and satellite-like surrounding Cho/Cr maxima (figure 4, table 1).
Topographic correlation of chemical shift imaging (CSI) choline (Cho)/creatine (Cr) and CSI Cho/N-acetylaspartate (NAA) maxima. (A–C) Left frontal oligodendroglioma WHO grade III (case 30). (A) Cho/NAAmax; (B) Cho/Crmax; (C) Cho/NAA and Cho/Cr coregistration resulting in >50% maxima overlap. (D–F) Right insular oligoastrocytoma WHO grade III (case 19). (D) Cho/NAAmax; (E) Cho/Crmax; (F) Cho/NAA and Cho/Cr coregistration resulting in <50% maxima overlap. Note the central Cho/NAA maximum and satellite-like surrounding Cho/Cr maxima.
Histopathological criteria
Of the 32 patients with DIG, tissue samples inside and outside the CSImax and PETmax of a given tumour were available in 25 and 17 cases, respectively. In the remaining patients, biopsies were taken only from the site of the metabolic maximum and thus had to be excluded from this analysis (table 2).
Histopathological criteria
For the histopathological criteria of anaplasia (mitotic figures, necrosis, microvascular proliferation, increased cell density and nuclear pleomorphism), mitotic figures were significantly more frequently present within CSI and PET maxima as compared with peripheral tumour regions. Further, microvasular proliferation was significantly more frequently encountered inside PETmax and nuclear pleomorphism inside CSImax as compared with peripheral tumour areas.
For both CSI and PET, the proliferation rate assessed by MIB-1 LI was significantly higher inside the maximum metabolite ratio area than outside. In the cases with negative or non-specific PET tracer uptake, CSImax still exhibited a significantly higher proliferation rate than in the surrounding tumour areas (10.8% inside CSImax versus 5.2% outside CSImax, p=0.011).
Discussion
CSI is a metabolic imaging technique that is widely available and does not expose the patient to radiation. In this study, we investigated the clinical usability of CSI for detection of anaplastic foci in DIG with non-significant CE and performed a correlation with MET-PET. We found pathological CSI ratios in all patients, whereas MET-PET was pathological in only 21/32 patients. The CSImax and MET-PETmax showed a significant topographic overlap (≥50%) in the majority of cases (18/21 patients).
Previous studies have shown that MET-PETmax represents areas of highest malignancy within DIG.8 9 11 12 Consequently, we used MET-PETmax as the reference for topographic correlation with CSImax in our study.
A topographic correlation of the maxima of CSI and PET in DIG has been observed in single cases.32 33 A systematic topographic analysis has been performed in only two previous small exploratory studies: Go et al analysed three patients with DIG using multivoxel MRS and l-1-11C-tyrosine-PET.34 In two-thirds of patients, the choline MRS and tyrosine PET maxima showed significant topographic correlation; only partial overlap was observed in the third patient.
Stadlbauer reported ≥50% overlap of maxima of CSI (Cho/total NAA) and FET-PET in 11/15 patients and <50% overlap in 4/15 patients.10 His study design differed from ours by the use of a 1.5 T MRI, FET as PET tracer, inclusion of glioblastomas, biopsy only and use of Cho/total NAA CSI ratio for topographical correlation with PET only.
Despite the methodological differences, the results of all three CSI-PET correlation studies, including our own study, are similar and indicate that CSI maxima represent metabolically active areas in DIG.
For the detection of metabolically active areas in gliomas by changes in metabolites on MRS, different methods have been described: the calculation of relative metabolite levels in relation to normal brain tissue (such as the Cho-to-NAA index, CNI) has certain advantages, such as the generation of stable measures of Cho abnormality in voxels that have very low or absent NAA.35 Low or absent levels of NAA, however, are typically encountered in WHO grade IV gliomas which were not the primary pathology of interest in the present study. We therefore assessed the ratios Cho/Cr18 21–28 and/or Cho/NAA10 18 21–23 25 26 derived from direct output of the commercially available MRI software package that are most commonly reported in the literature.
Topographic correlation of the maxima of both ratios revealed a high degree of overlap (≥50%) in most cases (24/32 patients). The remaining 8/32 patients showed an overlap of <50%: six of these patients (three oligodendrogliomas, two oligoastrocytomas and one astrocytoma) had a central Cho/NAA maximum surrounded by multiple satellite-like Cho/Cr maxima. This characteristic pattern has not been described so far. It remains to be shown whether the centre and the satellites are histologically different. Future studies could also clarify whether this peculiar Cho/NAA-Cho/Cr pattern is specific to gliomas with an oligodendroglioma component, as observed in 5/6 of our cases.
In our series, pathological CSI ratios were detectable even in patients without pathological MET-PET (11/32 cases; figure 5). In 4/11 of these patients, histological examination revealed an anaplastic glioma. Floeth reported glioma patients with pathological single voxel spectroscopy but no pathological FET-PET.5 Nelson reported that MRS was more reliable in tumour identification than 18F-fluorodeoxyglucose-PET in 12/38 cases.36 These three independent observations indicate that MRS may visualise metabolically active areas within DIG more sensitively than PET.
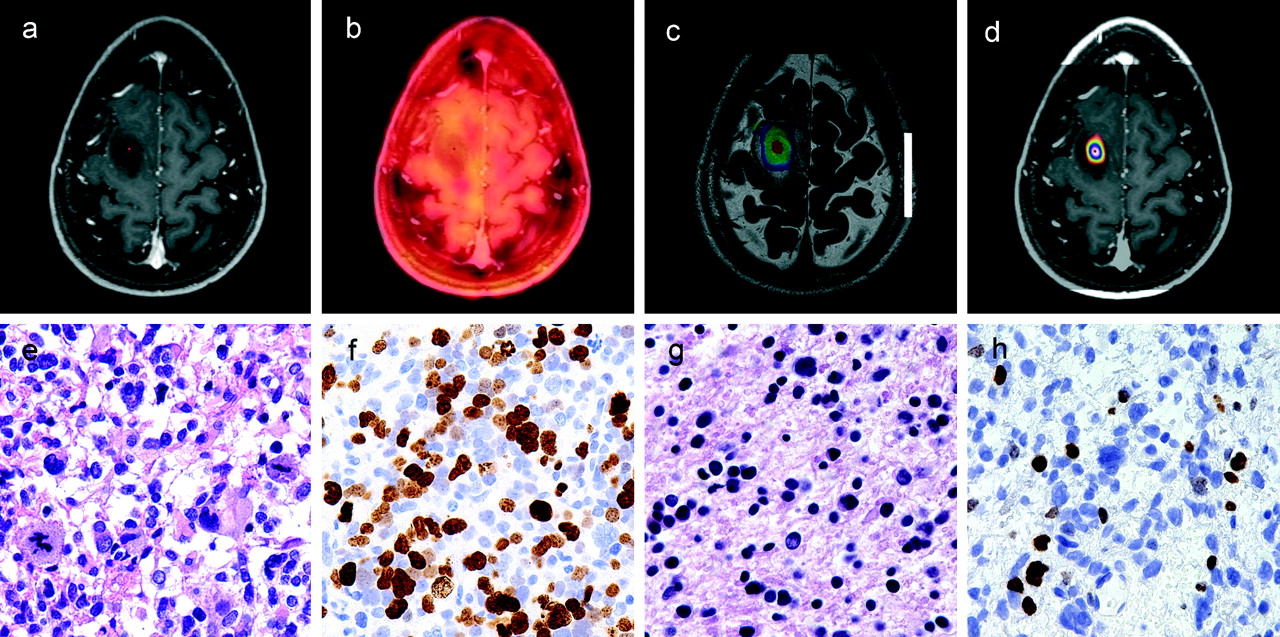
Non-specific 11C-methionine (MET)-positron emission tomography (PET) tracer uptake with chemical shift imaging (CSI)max in a left precentral oligoastrocytoma WHO grade III (case 16). (A) T1-weighted contrast-enhanced MRI. Note the non-enhancing left frontal lesion. (B) MET-PET without distinct focal maximum. (C) Complete single-slice CSI (choline (Cho)/N-acetylaspartate (NAA)) as derived from MR postprocessing depicting a central CSImax. (D) Focused CSImax (Cho/NAA) after windowing at the navigation workstation. (E–F) Tissue sample from CSImax. (E) HE depicting prominent anaplasia of the astrocytic tumour part with brisk mitotic activity (magnification ×200). (F) MIB-1 labelling index of the Ki-67 antigen >40% (magnification ×400). (G, H) Tissue sample from outside CSImax. (G) HE depicting a low-grade tumour area. (H) MIB-1 labelling index of the Ki-67 antigen <9%.
The number of patients in our series without pathological MET-PET seems high compared with other studies. One possible explanation is the relatively high cut-off value in our series. Whereas other studies used lower cut-offs (between 1.2 and 1.5),6 7 12 37 38 we defined a rather high cut-off of T/N ratio ≥1.5 as pathological for the following reasons. According to our experience, gliomas with T/N ratios between 1.15 and <1.5 often demonstrate diffuse tracer uptake without a distinct focal maximum. This situation does not allow a reasonable topographic correlation with CSImax as we observed in all four patients with a T/N ratio between 1.2 and 1.4. In contrast, a distinct focal maximum of MET-PET was detected in all patients with a T/N ratio ≥1.5, which does permit topographic correlation with CSImax.
Cut-off values for pathological CSI ratios have not been consensually defined in the literature so far. Therefore, we empirically defined CSI ratios of ≥1.0 as pathological (see Methods). Thereby, we achieved specific colour-coded visualisation of distinct intratumoural CSI maxima, whereas regions in the normal brain were not visualised (figure 5C). According to this cut-off definition, all patients in our series had clearly pathological maxima of CSI.
Herminghaus reported a significant correlation of total choline concentration with MIB-1 LI in neuroepithelial tumours using single voxel MRS, which was proposed as a preoperative tool for tumour grading.39 Due to potential intratumoural heterogeneity, however, single voxel MRS may miss small anaplastic foci.
To determine the ability of CSI to detect such anaplastic foci, we assessed the WHO criteria of anaplasia as well as the cell proliferation rate measured by MIB-1 LI in tumour samples inside and outside CSImax. A significantly higher MIB-1 LI, presence of mitotic figures and nuclear pleomorphism were encountered inside the CSImax (see table 2). As CSImax and PETmax showed a significant topographic correlation in the majority of patients, MIB-1 LI, presence of mitotic figures and microvascular proliferation were significantly higher in the area of maximum PET tracer uptake as well. It is of note that even in cases with negative or non-specific PET tracer uptake, CSI was able to depict tumour areas of increased proliferation rate.
Current limits of CSI
The low spatial resolution of CSI of 1 cm is an inherent limitation for detection of intratumoural anaplastic foci. Compared with the higher resolution of PET (0.4 cm), however, these data demonstrate that CSI visualisation of intratumoural ‘hotspots’ correlates with PETmax topographically and may be of additional value in cases of negative or non-specific tracer-uptake in PET scans.
The largest diameter of the suspected glioma on T2-weighted images was our key criterion for selection of the single CSI slice, without knowledge of MET-PET findings. Such an approach may miss PETmax. Indeed, coregistration of CSImax and PETmax revealed a PETmax outside the selected CSI slice in 3/38 patients.
Reliable detection of the metabolically active tumour areas may be achieved by three-dimensional CSI.35 36 Alternatively, multislice CSI could solve the problem. This method uses parallel contiguous CSI slices covering the majority of the tumour volume. We are currently testing the reliability of multislice CSI at our centre.
Artefacts alter CSI spectra adjacent to bony structures, which impedes reliable detection of superficially localised metabolically active tumour areas. In our patient series, proximity to bone did not allow CSI investigation in the area of PETmax in 3/38 patients. CSI software modifications may reduce bone artefacts. However, it seems unlikely that bone artefacts can be completely eliminated. Therefore, PET will remain indispensable for reliable visualisation of malignant/metabolically active tumour areas in proximity to the bone.
Outlook
According to our findings, coregistration of CSI with standard anatomical MRI seems to be a promising application that may complement the established PET, functional MRI and diffusion tensor imaging coregistrations, and thus optimise multimodal image-guided neurosurgical procedures. Indeed, some other groups also have started to incorporate CSI data into neuronavigation.30 40
Conclusion
These data suggest that CSI using Cho/Cr and Cho/NAA ratios is a clinically reliable non-invasive and widely available technique for detection of anaplastic foci in DIG with non-significant CE. CSImax shows a significant topographic correlation with PETmax in the majority of our glioma patients. Further, CSImax corresponds to regions with increased proliferative activity within these tumours. Therefore, the intraoperative use of CSI data by multimodal neuronavigation may increase the reliability of detection of malignant areas in DIG with non-significant CE and consequently optimise allocation of patients to adjuvant treatments.
Acknowledgments
We thank H Heinzl, Department of Medical Computer Sciences, for statistical advice; I Dobsak for drawing the illustration; and I Leisser and G Ricken for technical assistance with preparation of tissue specimens. This study was performed within the PhD thesis project of Clinical Neuroscience (CLINS) at the Medical University Vienna.
References
Footnotes
Competing interests None.
Ethics approval Ethics approval was provided by the ethics committee of the Medical University of Vienna.
Provenance and peer review Not commissioned; externally peer reviewed.